How Marketing-Influenced Revenue Clarifies What Attribution Misses

What's inside


Attribution is one of the most heavily debated topics among marketers. There’s no consensus on how to do it correctly, and the marketers with some form of attribution in place question their data.
According to survey results from RevSure and Ascend2, only 31% of marketers feel highly confident about the accuracy of their marketing attribution.
With all this confusion, how are you supposed to measure the impact of your programs?
The answer is to re-think attribution altogether.
In this guide, we’ll explain:
- What marketing-influenced revenue is
- Why it’s a vital KPI for B2B marketers
- How to use it to measure the full impact of your programs
What’s the difference between influence and attribution?
Attribution is a way to credit specific marketing activities with a conversion.
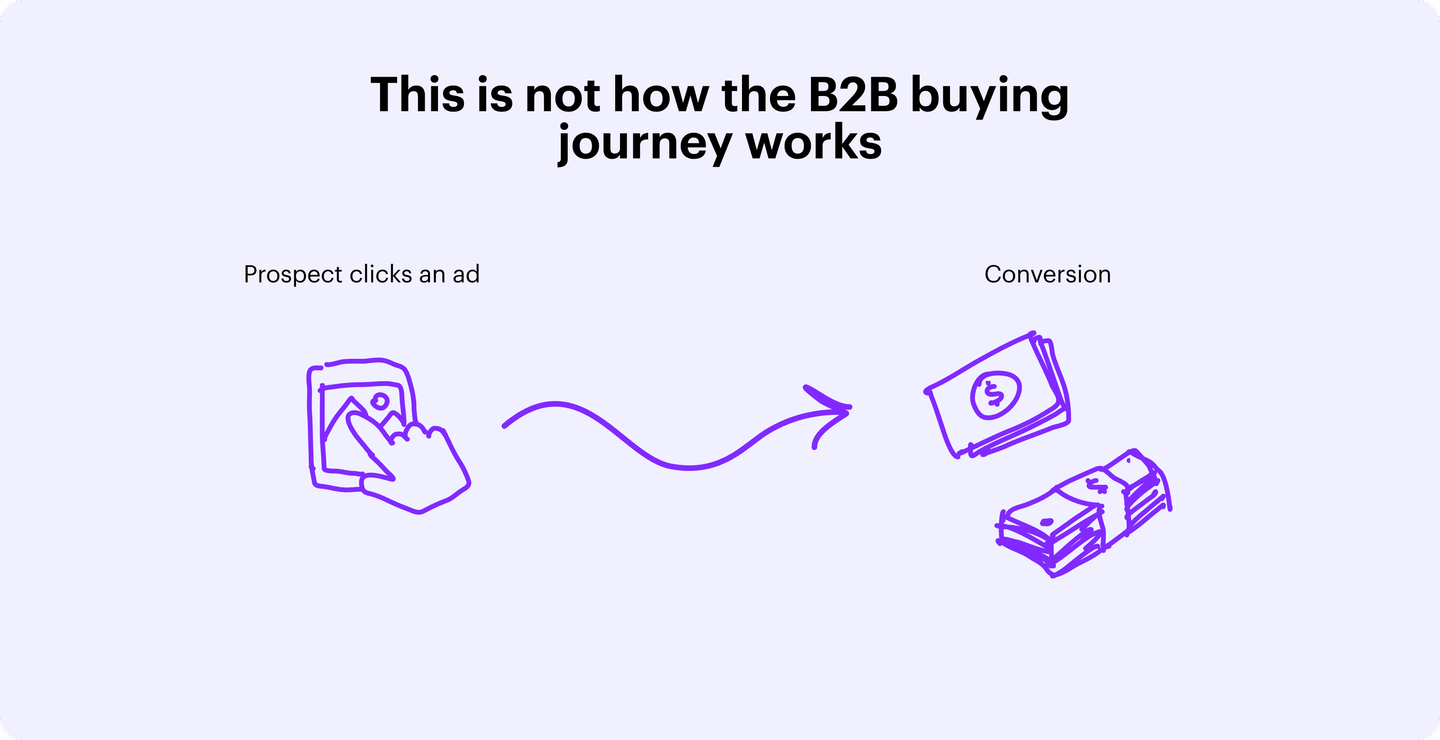
The most basic example is when a prospect clicks your ad and then fills out a form on your website. The conversion would be attributed to the ad click.
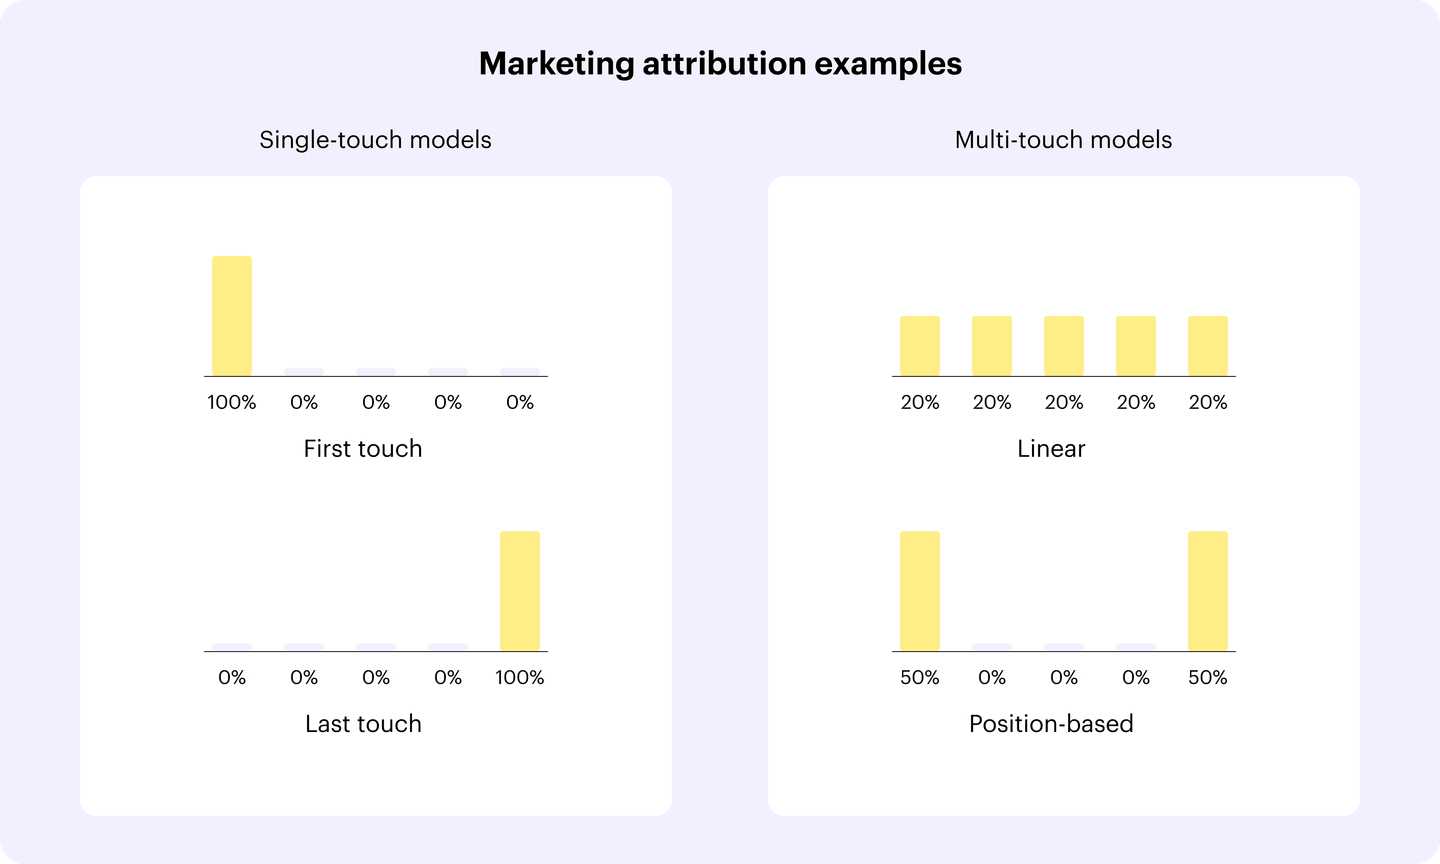
However, there are a bunch of different attribution models. For instance, first and last touch attribution credits the first or last marketing touchpoint for conversions.
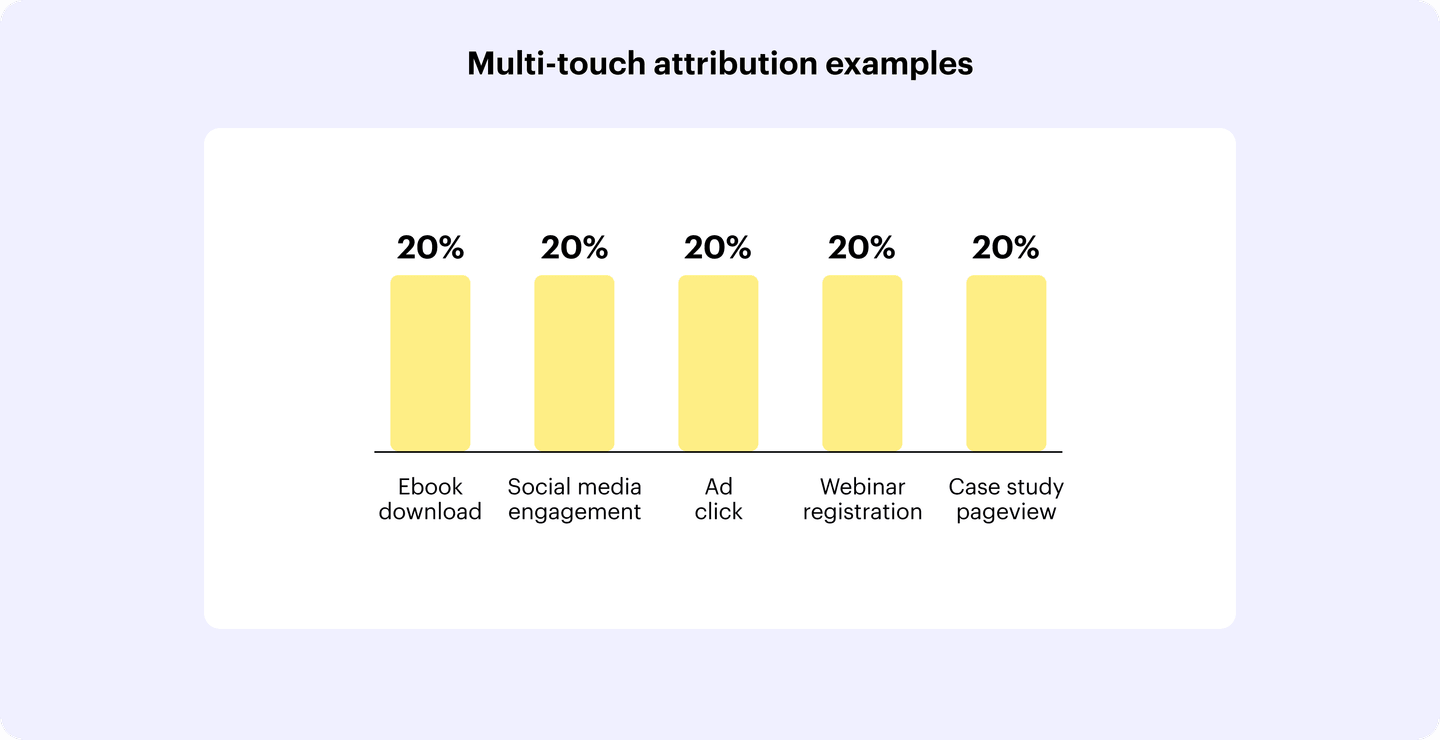
You also have multi-touch attribution models that credit every marketing touchpoint for a conversion.
Think of marketing attribution like a map showing all the places someone visited on their journey. The map tells you where they stopped, but not what made the trip memorable or impactful.
As a marketer, you need to focus on what made an impact, not just where a prospect stopped.
That’s where influence comes in.
Marketing-influenced revenue measures how your programs contribute to deals throughout the entire buyer’s journey.
Influence is less about pinpointing the source of a conversion (because there often isn’t a single source for B2B deals) and more about understanding and quantifying the factors that influenced a prospect throughout the buyer’s journey.
For instance, if someone clicked on your ad but didn’t fill out a form, then converted two days later from another channel, attribution can’t account for it but an influence model can.
Going back to our map analogy, influence not only tells you where a person stopped, but also how each stop and the activities that happened in between impacted the trip.
Why measuring influence makes more sense than attribution for B2B companies
The goal of attribution is to answer two main questions:
- Do my programs increase pipeline and revenue?
- How much credit can I attribute to each program?
Answering these questions helps you understand what’s working and prove the impact of your programs.
Attribution doesn’t really give you reliable answers to these questions, but influence does. Here’s why.
Attribution is often inaccurate
For attribution to work, you need to accurately track each engagement from an account, across multiple buyers and channels.
This requires a combination of form fills, cookies, UTM parameters, and other methods to track each touchpoint. Collecting and calculating this throughout the buyer journey leaves a lot of room for error.
Some people won’t fill out your forms, 67% of US adults disable cookies, and UTM parameters give you limited data.
That’s why so many marketers struggle to build an attribution model they trust.
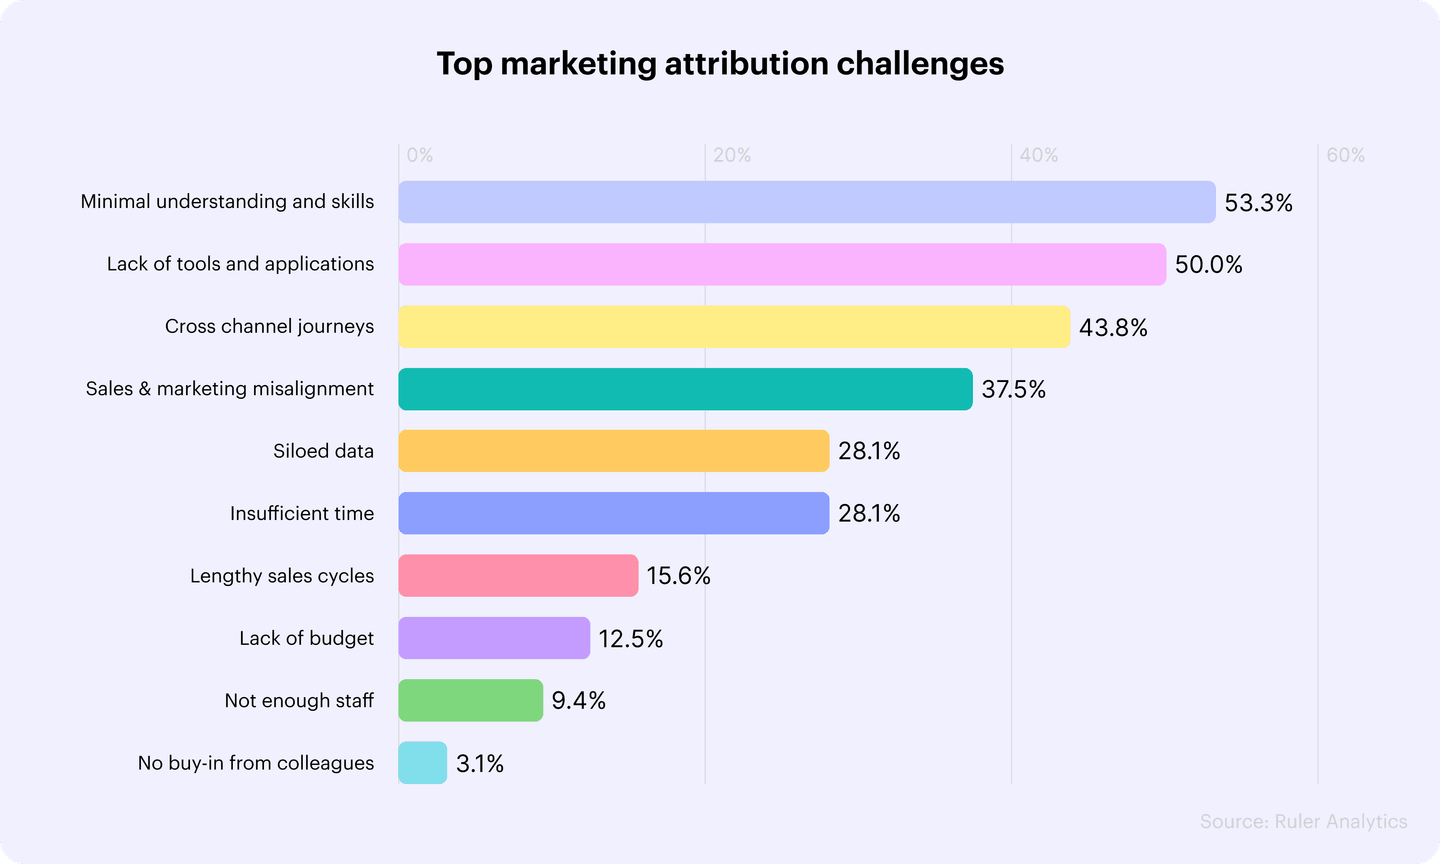
A Ruler Analytics survey found that 43.8% of marketers think tracking cross-channel journeys is one of the top challenges for attribution. And 50% say they lack the tools to be successful.
Let’s look at two examples of how a lack of clean data creates issues with attribution.
First, say someone sees your ad on LinkedIn but doesn’t click. Later, they remember the ad, Google your brand, and visit your website. One of two things might happen:
- They’ll give you their contact info via a signup form, content download, etc.
- They’ll leave the site, and potentially convert later down the road
In either case, the original ad they saw isn’t credited with a conversion at all, even though it was their first interaction with your brand.
Here’s another common scenario.
A prospect unfamiliar with your company sees your ads over the course of two weeks but doesn’t click. Later on, an SDR reaches out and gets a response, and the prospect converts.
Even though your program influenced the deal through the ad impressions, attribution models can’t capture that activity.
Based on that example, you might think your ads aren’t working, when, in fact, they are.
The lack of clear and accurate data from attribution can cause you to make bad decisions based on incomplete and inaccurate data.
Influence solves this by looking at the totality of your program. Those impressions would be tracked and count towards influencing the pipeline generated from the opportunity.
At Influ2, we have a unique approach to measuring influence, which we’ll dive into a bit later, that doesn’t require form fills, cookies, or the other tracking methods that lead to the issues you experience with attribution.
Attribution doesn’t reflect how B2B buyers shop
Attribution is very binary. It says, “Someone engaged with this marketing program, which led them to buy our product.”
That logic may work for B2C brands, where the price tags are lower, and buying decisions are made by a single person in a short period of time.
However, that’s rarely the case for B2B deals.
The B2B buyer journey often looks more like this.
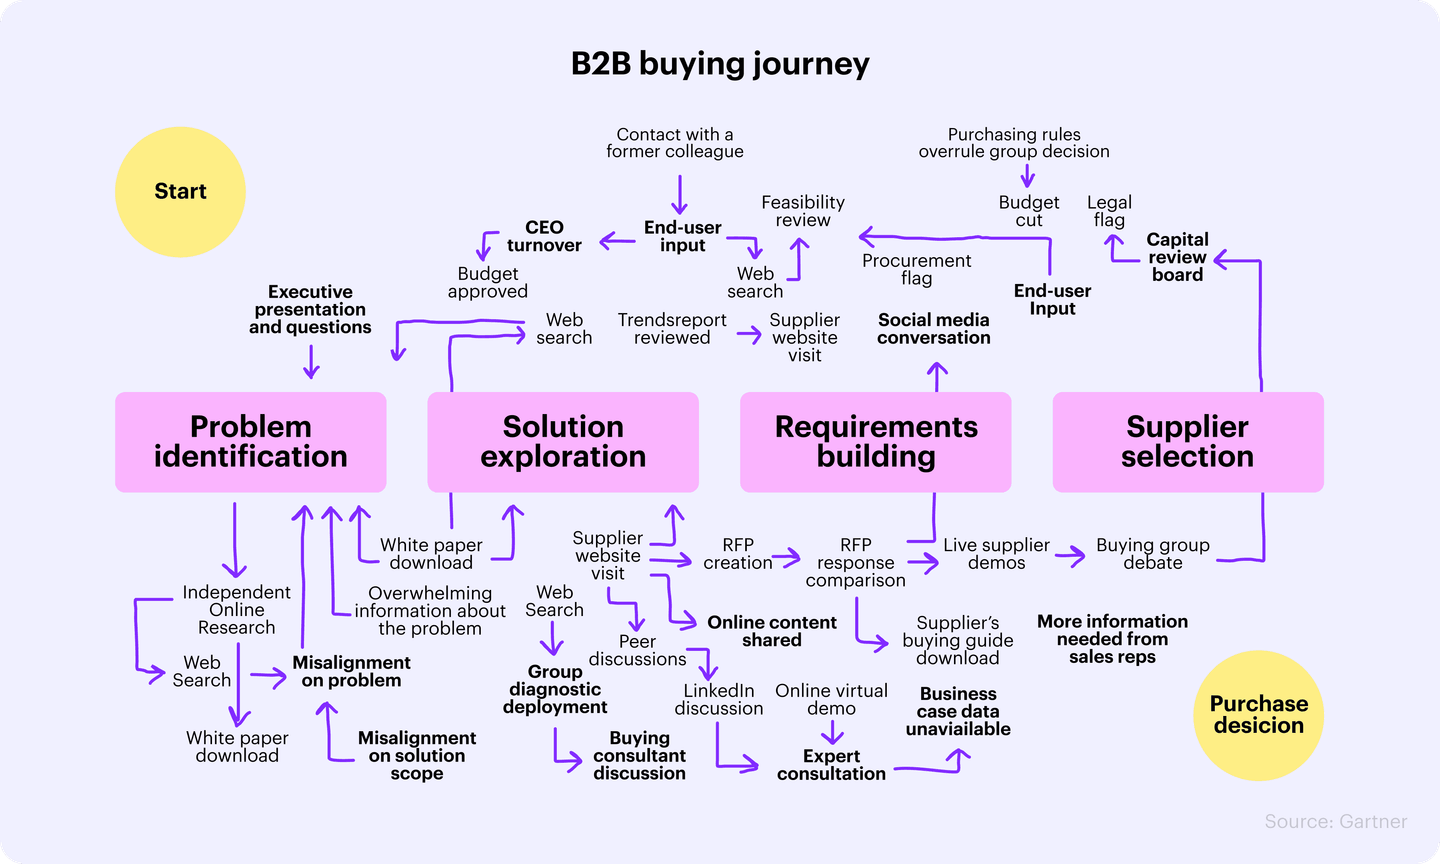
It’s an intricate web of decision-makers, research, considerations, and discussions that take place over the course of months.
Marketing and Sales will engage with multiple people from an account throughout the process. Imagine pinpointing which of these interactions should get attribution for a deal.
Since there isn’t a single conversion point for most B2B deals, attribution can create a false narrative of what led customers to buy from you.
Influence paints a more realistic picture by showing you all the factors that contributed to a deal from start to finish, not just when someone filled out a form.
Attribution drives poor strategy
The decision-making process can be complex.
To get prospects through the finish line, the most effective marketing programs should have an overarching goal of reducing friction throughout the entire buying journey.
Often, marketers measured by attribution focus less on that and more on maximizing the number of attributable leads they can generate. The end-to-end buying journey takes a back seat instead of being the priority.
And as the saying goes, what gets measured gets optimized.
When your strategy is built around attribution, it naturally pushes you to optimize for conversions of individual marketing channels, which creates another major issue—your strategy doesn’t align with your sales team’s.
In Hubspot’s 2024 State of Sales Report, 61% of respondents said sales/marketing alignment is more important than it was last year, and 39% cited goals and strategy alignment as a top priority.
Measuring marketing-influenced pipeline means you don’t have to focus on optimizing every single conversion point like you would with attribution.
Instead, you can concentrate on growing pipeline. This way, you and the sales team are working toward the same goal, which encourages better collaboration and alignment in your strategies. And the data shows that when Marketing and Sales are aligned, revenue grows.
Attribution creates unnecessary friction between marketers and salespeople
When you’re focused on who gets “credit” for conversions, it can create a power struggle between Sales and Marketing.
Attribution feeds into this by treating the B2B buying journey as a collection of touchpoints instead of what it really is—an integrated experience with multiple factors contributing to each deal.
What ends up happening is Sales feels like Marketing is trying to “take credit” for deals they close, which creates friction.
However, when you shift your focus away from attribution, it changes your conversation and relationship with Sales.
Instead of talking about conversion attribution, you can talk about how your programs help influence the deals Sales is pursuing and quantify the lift you’re providing (don’t worry, we’ll show you how).
How the influence model works
Next, let’s look at how influence models work, using our own as an example.
The model has specific criteria for what constitutes an influenced deal: At least one buying group member must have seen your ads 15 times or engaged once within 15 days of a positive sales outcome.
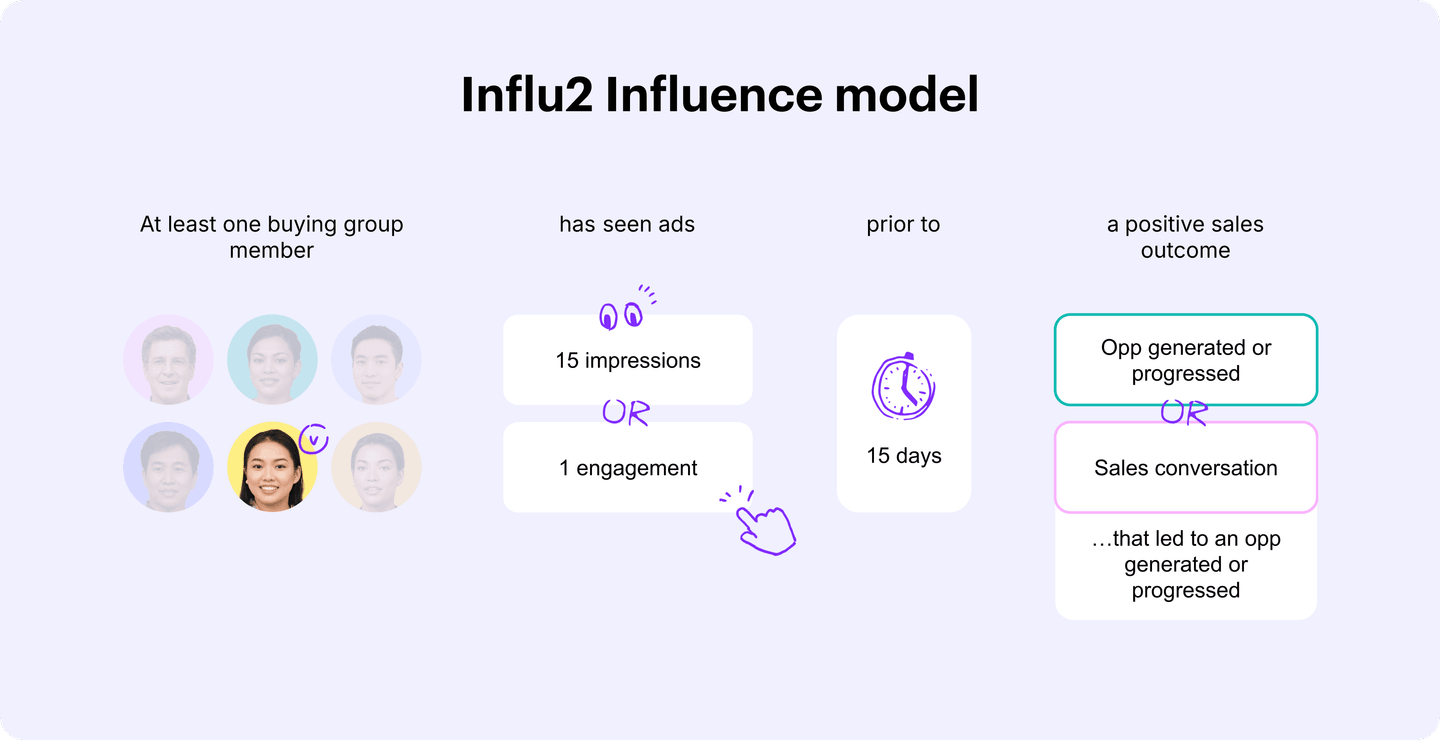
Let’s break down each piece of the influence model in more detail.
The influenced person
First, we look at the person behind the influence.
It needs to be a prospect in the buying group you’re targeting. That helps avoid counting people who may work at a company but aren’t part of the buying process.
This highlights one of the issues that make attribution data from account-based ad platforms inaccurate.
When you target at an account level, you don’t really know who’s seeing and engaging with your ads. It could be a decision-maker you want to reach or someone in a different department who can’t benefit from your product.
Since we deliver contact-level ads, we know your ads are being seen and clicked by prospects you actually want to reach.
We also have the unique benefit of being able to tie ad impressions and clicks to your targeted prospects regardless of whether or not they filled out a form or have cookies enabled.
All of the scenarios we described earlier of a person seeing an ad but not clicking can be properly accounted for with Influ2.
Intent signals
Next, there needs to be an intent signal from the buying group member. This can be either indirect (ad impressions) or direct (clicked an ad).
But how do you know when an ad click or impression actually influenced a deal?
We crunched the numbers.
We analyzed over 600K accounts and 9 million targets over a three-year period, comparing converted accounts where one ad click was present (influenced) to ones without (cold).
On average, the influenced accounts (with at least one ad click) generated 80-100% more conversions than cold accounts.
Similarly, accounts with 15 impressions had 30-40% more conversions than those with none.
Based on this research and a few other data points, we set a threshold of at least one ad click or 15 impressions to signal that a deal was influenced by ads.
Window of time
Another important piece of our influence model is timing.
The timeline between when a person sees or clicks an ad, and when they take action is just as important as the impression or click itself.
People’s interest and ad recall decay over time. In fact, one Nielsen study found that people’s ability to recall an ad they saw dropped by 50% within 24 hours.
Setting a reasonable timeframe between a marketing activity and when a prospect moves forward in the sales process helps avoid giving credit to older marketing touchpoints that likely had little to no influence on a deal.
Influence models look at the time between an intent signal and a positive sales activity.
If the intent signal occurs within 15 days of positive sales activity, it is highly probable that it influenced the deal.
A positive sales outcome
The final part of the model is checking for a positive sales outcome.
A positive sales outcome is an activity that moves the deal forward, including:
- A booked meeting
- A newly created opportunity
- An opportunity that has progressed
This step is important because it connects the dots between marketing touchpoints and sales engagement.
Part of our ethos is that Sales and Marketing need to work towards the same goal. Measuring marketing influence based on positive sales outcomes helps make that possible, and is a more accurate gauge of success than marketing-specific metrics like MQLs.
How we quantify marketing influenced pipeline and revenue
Once we’ve determined that an account was influenced by your campaigns, the next step is quantifying the influence.
We do that through our Revenue Reports.
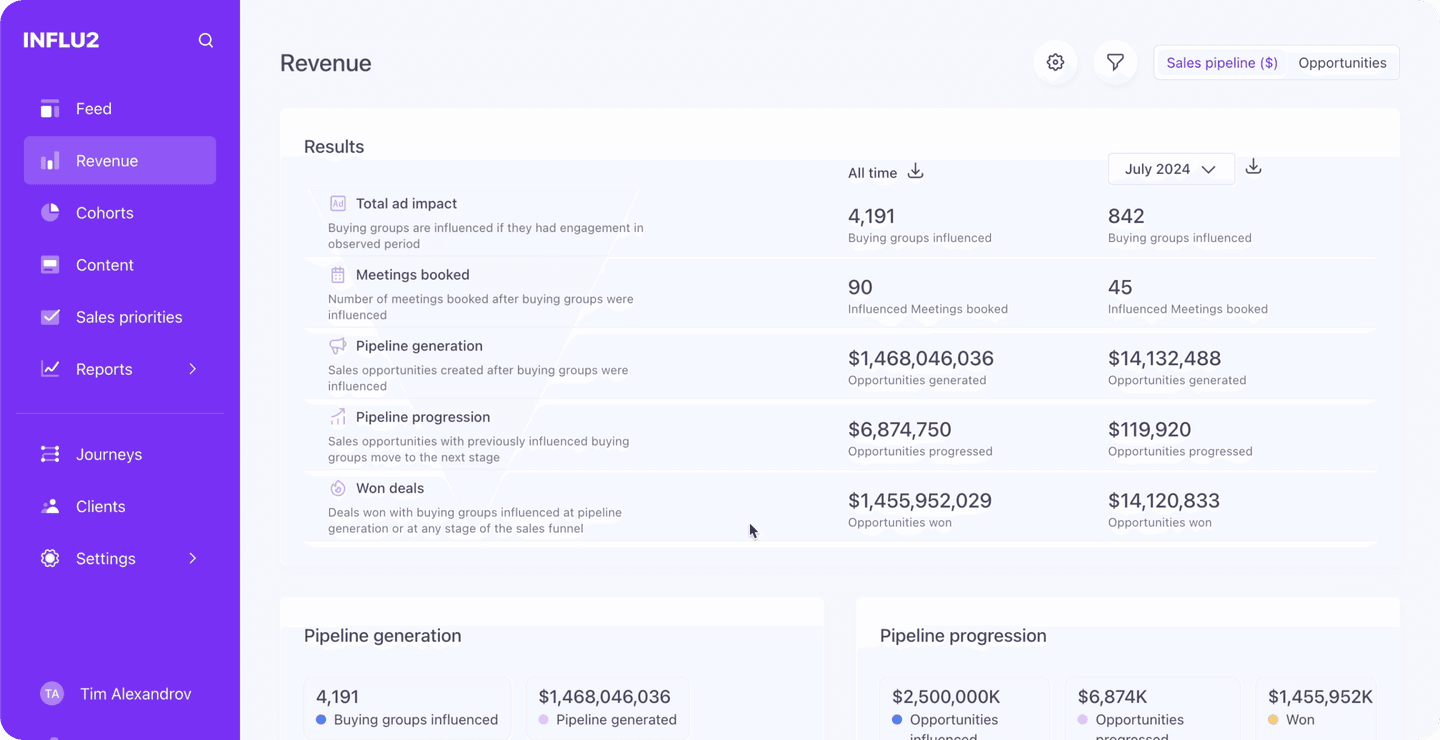
As you can see in the screenshot above, we highlight the influence of your campaigns through every stage of the sales process.
Specifically, we show you:
- The number of buying groups your ads have influenced
- The number of booked meetings your ads have influenced
- How much generated pipeline your ads influenced
- How much progressed pipeline your ads influenced
- How much revenue your ads influenced
Breaking down the data in these stages helps you analyze your GTM efforts and see where there may be opportunities for improvement.
For instance, if your programs influence a significant amount of pipeline generation or progression but don’t result in won deals, that could indicate the sales team is struggling to convert.
These reports also help when it’s time to present your campaign performance.
Seeing influence by stage makes it easier to explain how your campaigns impact revenue from start to finish so you can create a data-driven narrative about what’s working and what’s not.
How to calculate the additional value created by your program
One of the best ways to measure the value of your program is by comparing deals that were influenced by your program to those that weren’t.
This is a huge missing piece of the puzzle when it comes to attribution.
Attribution assumes that specific marketing touchpoints contributed to deals won.
For example, a linear multi-touch attribution model with five different marketing touchpoints credits each engagement with the closed deal.
But if you were to remove the ad click or ebook download, how much would it have impacted pipeline, revenue, or conversion rates?
Many marketers struggle to answer this question because they don’t have the data. However, that data point goes a long way in justifying your budget and proving the value of your programs.
Influ2 can help you get the answer.
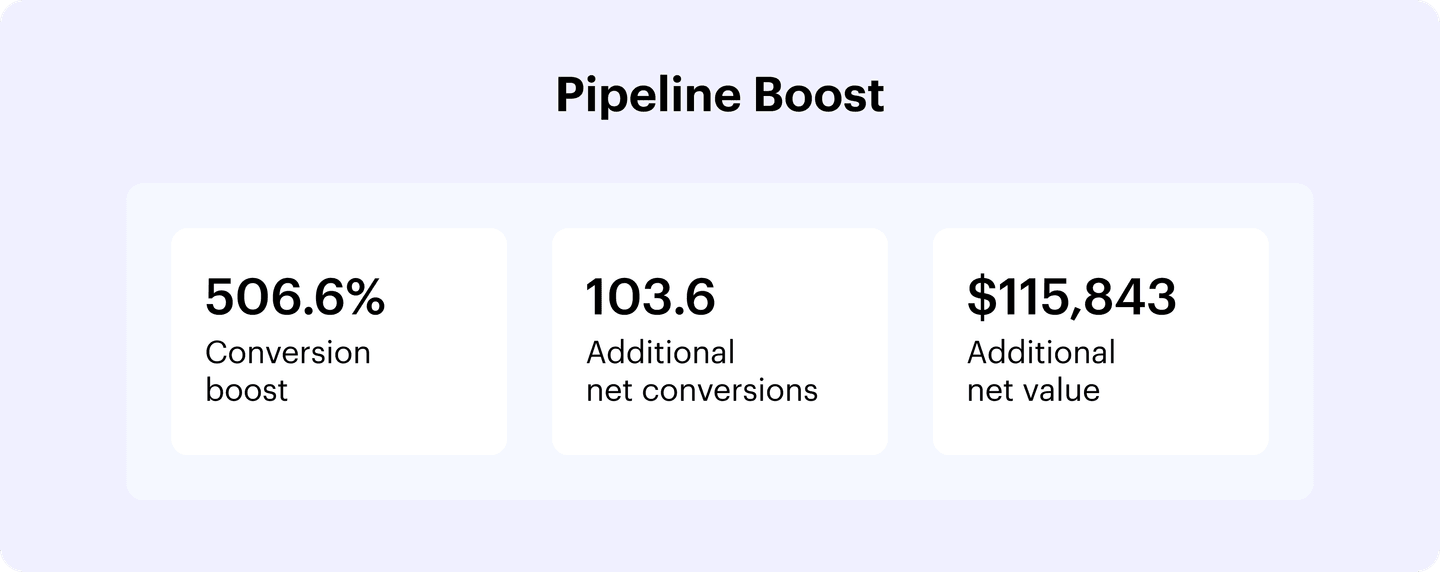
In our Value Analysis report, you can compare the number of sales outreach attempts, conversion data, and generated opportunities for influenced vs non-influenced accounts.
You can also see the boost in conversions, additional net conversions and net value for influenced accounts.
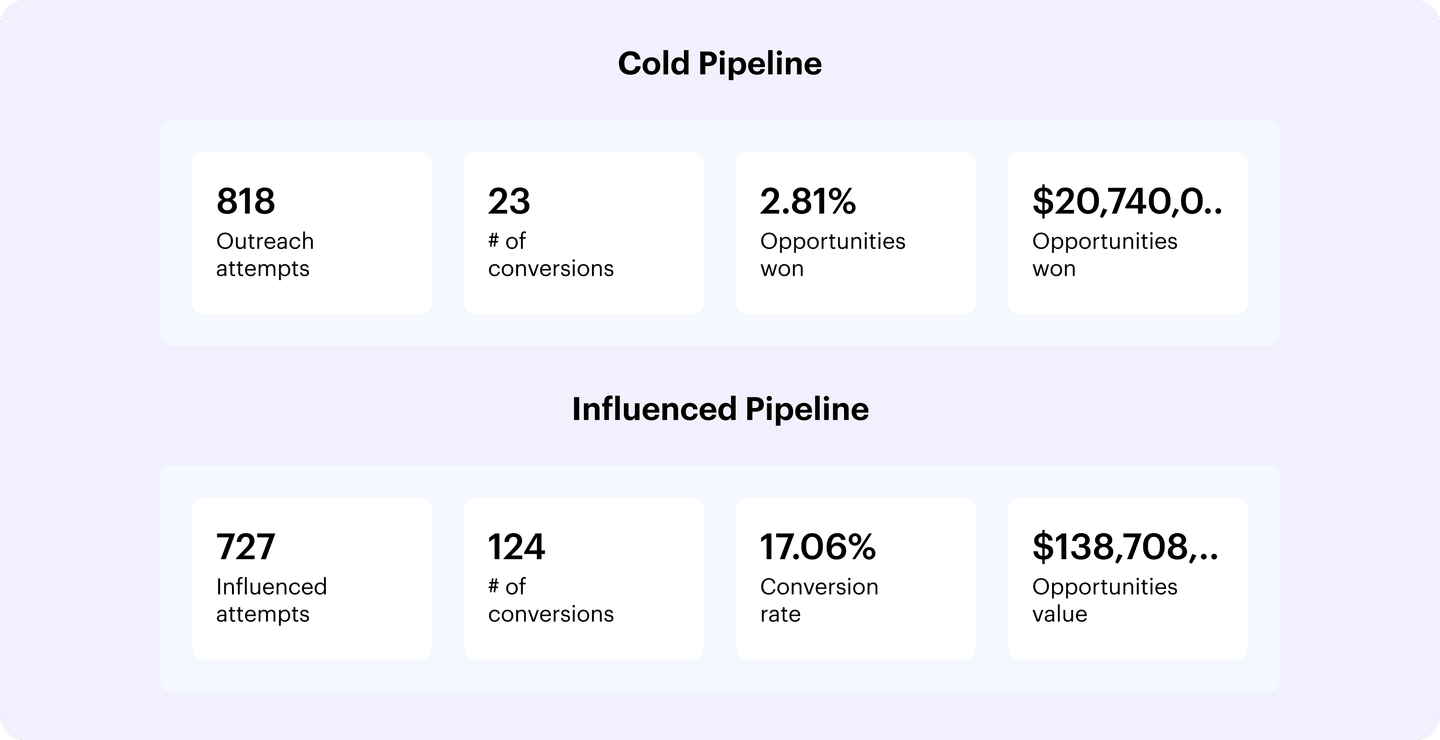
To calculate your boost in conversions, we first analyze your total generated pipeline as two groups:
- Cold pipeline = Pipeline that was converted without the influence of ads
- Influenced pipeline = Pipeline that was converted with the influence of ads.
We then compare the conversion rate for cold pipeline to the conversion rate of influenced pipeline.
For example, say your conversion rate for cold pipeline is 2% and the conversion rate for influenced pipeline is 3%.
Now, imagine that your amount of influenced pipeline is $15,000,000.
With a cold conversion rate of 2%, you would have only generated $10,000,000.
So, with a conversion rate of 3% instead of 2%, you have an additional $5,000,000 in created pipeline that you couldn't have generated without ads
We’re in a time where marketing budgets are getting cut left and right.
The ability to prove deals influenced by your marketing program have a higher conversion rate or create $X additional value goes a long way toward obtaining the resources you need for growth.
Prove the real value of your marketing program with influenced pipeline and revenue
Attribution can be an unnecessarily complicated (and inaccurate) way to measure the value of your programs.
If you want a clearer picture of how your marketing program influences revenue, and the ability to convey the data in a digestible way, let’s talk.
Book a demo to learn more about how to measure your marketing-influenced pipeline and revenue with Influ2.


