6 ABM Metrics That Actually Prove Your Program Is Working

ABM leaders are far from short on numbers.
Open up any ABM platform’s reporting suite, and you’ll find a list longer than your sales cycle of metrics to track, report on, and convert into boardroom-ready graphs.
The challenge isn’t getting access to the numbers; it's knowing which ABM metrics actually prove whether your program is working, and what to do about it if it isn’t.
This guide explores six ABM metrics that tie your program to pipeline and revenue, and a framework for presenting your results in a way that gives leadership what they need to see your program’s impact.
Why ABM reporting dashboards often miss what matters
In our Forrester report on contact-level ABM, we asked practitioners how they measure the effectiveness of their ABM efforts. Here’s what they said.
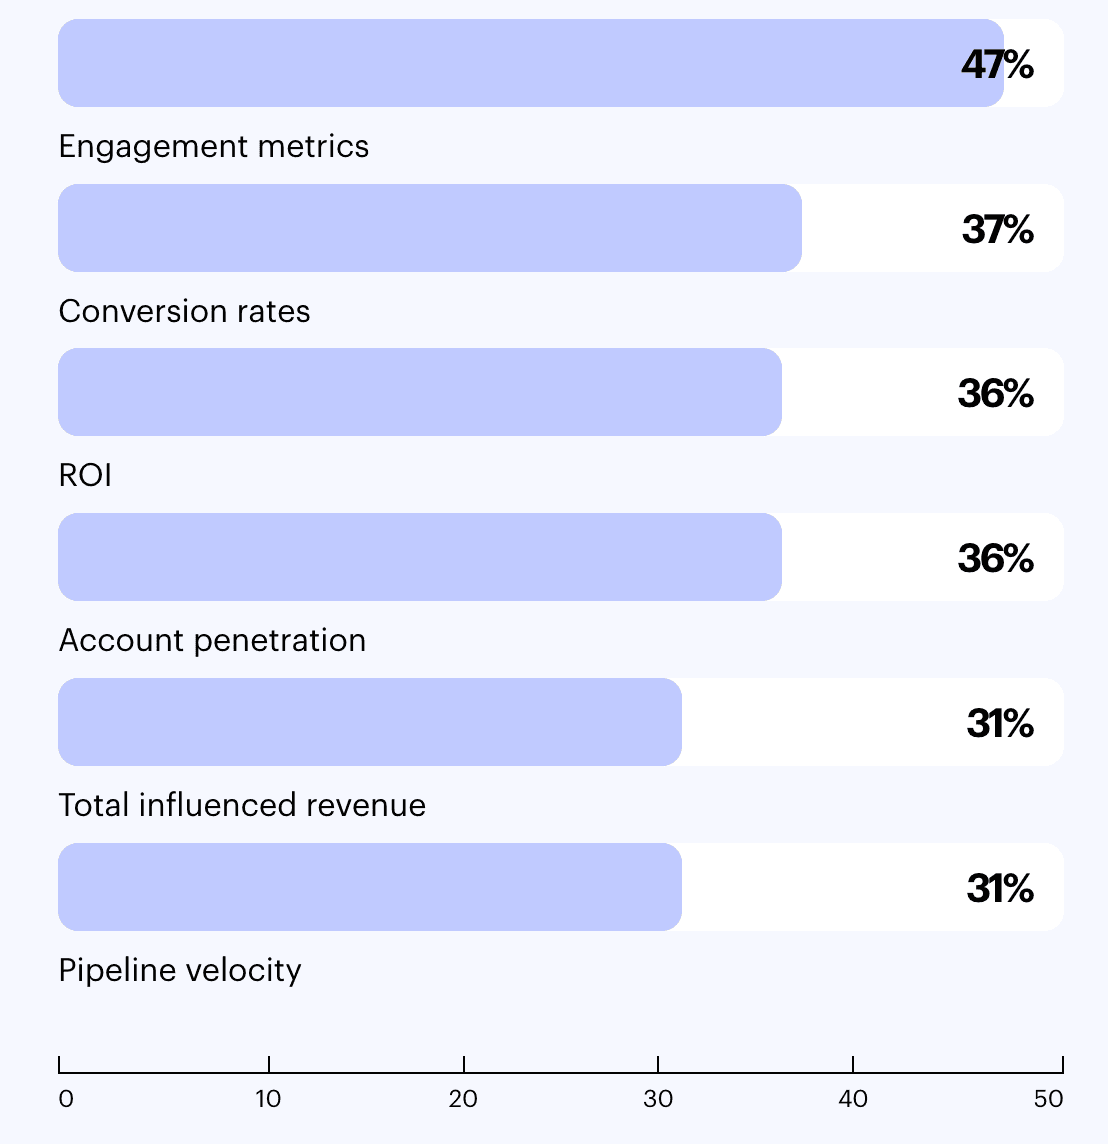
Engagement metrics (like email open rates and content downloads) are the number one category, not because they are the best reflection of program effectiveness, but because teams are limited to tracking what their ABM tools can capture.
These tools offer big reporting dashboards that are high on numbers but low on answers. MQA (marketing qualified accounts) is a classic culprit.
The problem with MQAs, and with many ABM metrics, is that they only tell you that something happened. They don't tell you whether that activity is building toward pipeline, or whether it's evidence that something you did is already working.
Leading vs. lagging indicators
Leading indicators tell you whether your program is building momentum. They're usually about engagement, like how many contacts across your target accounts you're actually reaching, and whether those contacts are progressing through defined journey stages.
Lagging indicators tell you what your program has already produced. They're about results, like pipeline generated, pipeline progressed, deals influenced, or revenue closed.
They’re usually what leadership cares more about.
Some metrics sit at the boundary between the two.
Marketing-influenced pipeline, for example, is a lagging indicator for pipeline, but a leading indicator for revenue (if pipeline is increasing, revenue should be too).
The six metrics below cover both categories.
Leading ABM metrics
Leading indicators are helpful to track because they give you time to course-correct.
If engagement is flat or coverage is thin, you can fix it before it becomes a pipeline problem. If leading indicators are increasing, it's a safe bet that pipeline or revenue will too.
1. Target account engagement rate
Target account engagement rate is the percentage of target accounts where at least one contact has been reached and shown meaningful engagement with your ABM campaign.
It’s the baseline signal that the accounts you care about are paying attention.
If engagement rate is rising across your target account list, it's an early sign that your program is gaining traction and getting better at connecting with identified stakeholders. A flat or declining rate is a signal to revisit targeting or messaging before the slowdown becomes a pipeline problem.
The trick with this metric is that it's only as meaningful as the threshold you set to consider a target account “engaged.” A single ad impression could technically be counted as “reached”, but it's not exactly a strong signal.
Teams should define a minimum bar before counting an account as engaged, and align that definition with sales upfront. Our data shows that in an ABM ad program, 15+ impressions or at least one click is the threshold that signals a meaningful increase in booked meeting conversion rates.
2. Buying group coverage
Buying group coverage takes the previous metric a step further, reporting on the percentage of key decision-makers and influencers within your target accounts that your program has successfully reached.
So, where target account engagement rate tells you “This % of accounts have been reached”, buying group coverage tells you “This % of contacts within a target account have been reached.”
Influ2 shows you how many contacts and buying groups you've engaged, giving you the data you need to calculate buying group coverage.
It's a crucial ABM metric to include in your regular reporting, as B2B deals rarely involve just one buyer. More commonly, they involve several stakeholders from multiple departments, each with different priorities and degrees of influence in the deal.
ABM programs that reach only one or two contacts per account leave the rest of the buying committee uninfluenced, and this usually shows up as an account that goes cold late in the process or an unseen objection blocking the deal from closing.
In our enterprise buying process survey, we found that senior leaders and executives carry the most weight for purchase decisions.
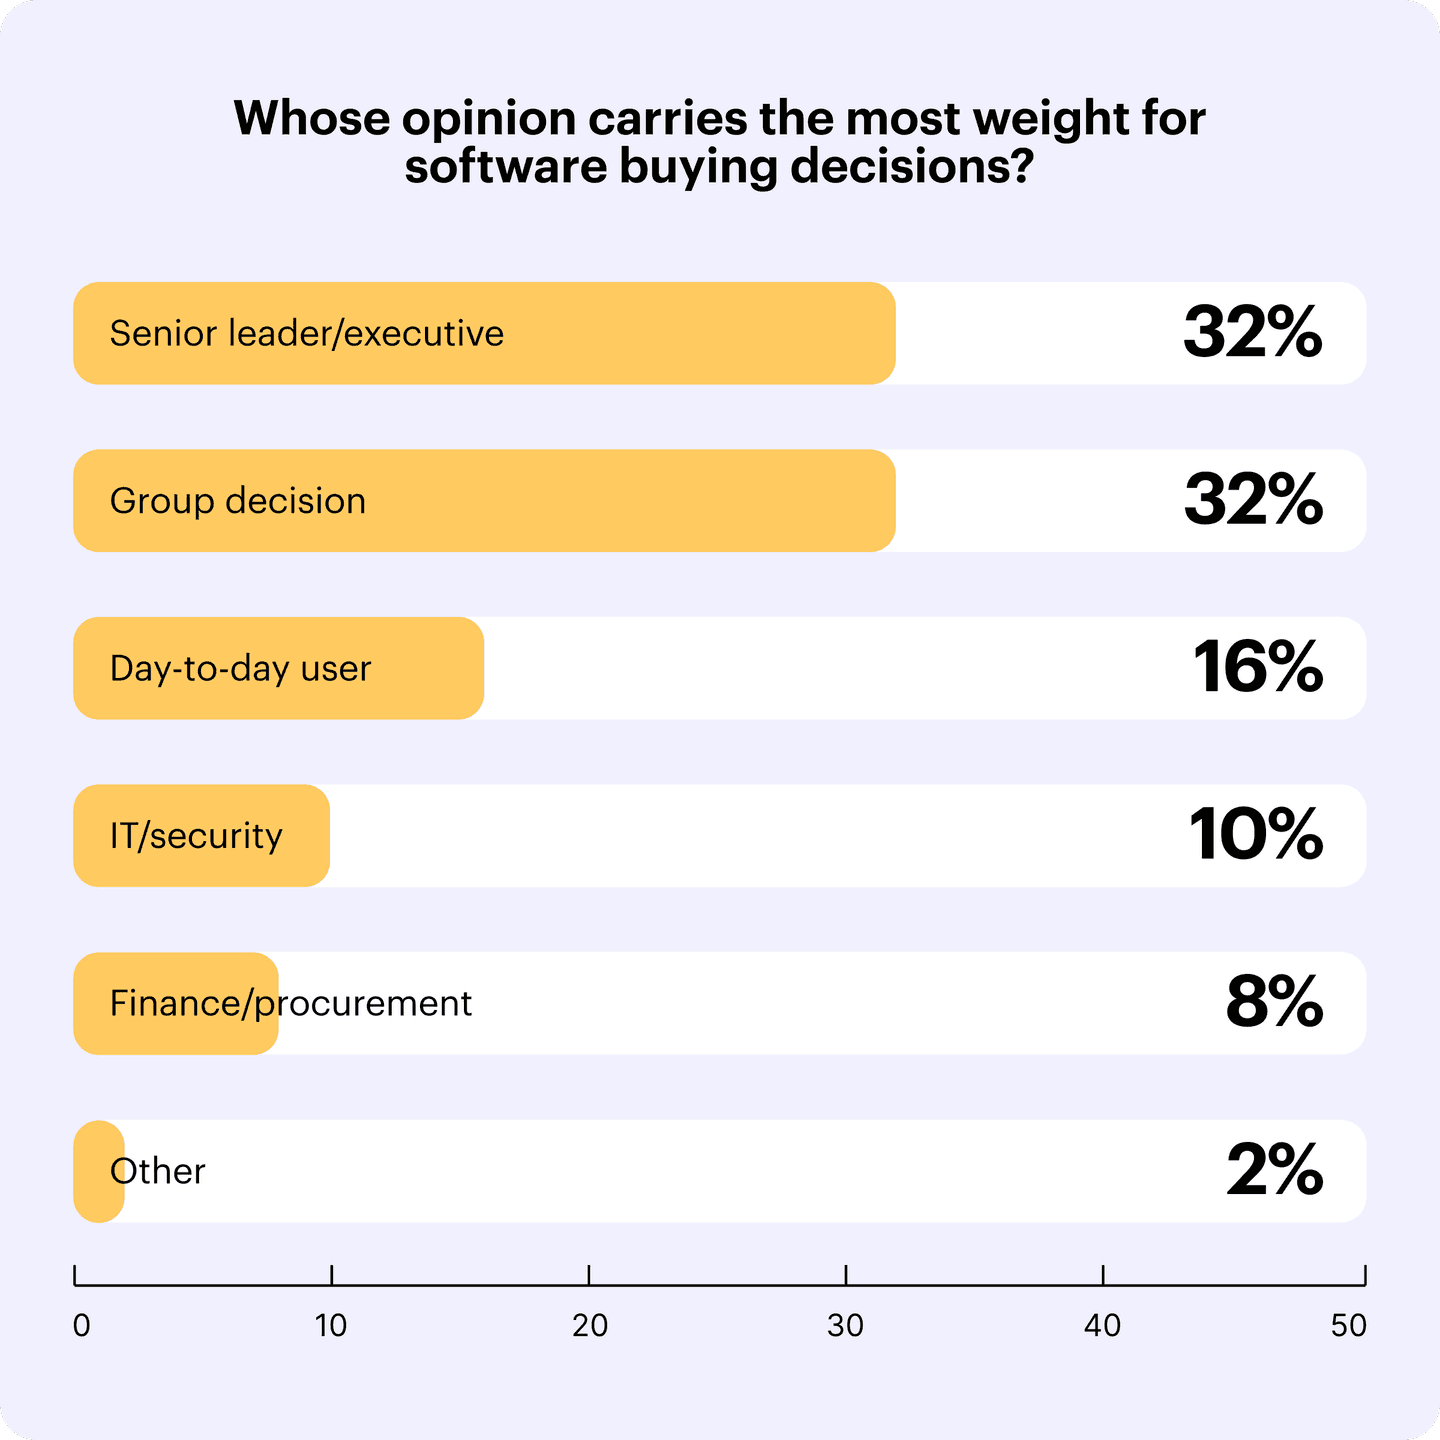
But that IT and finance tend to be the biggest blockers from getting a sale across the line.
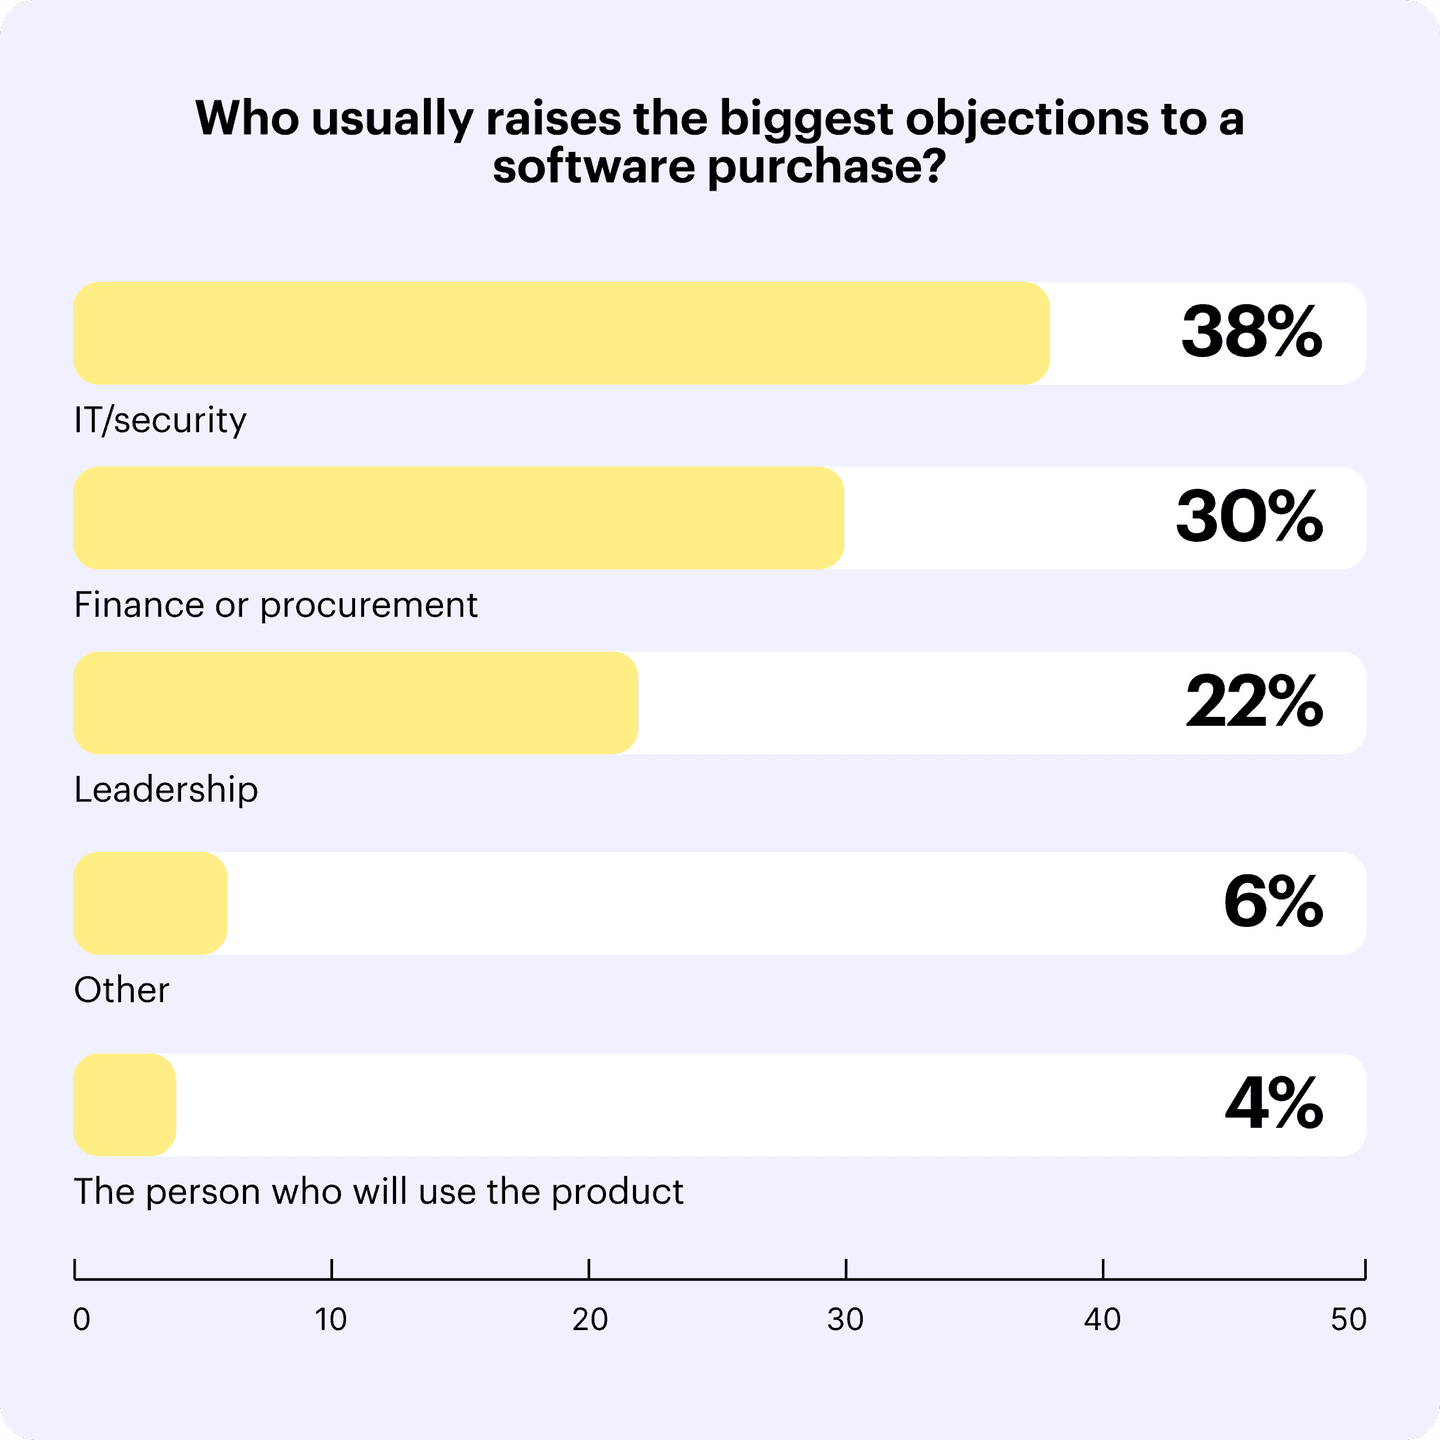
Failing to reach any one of them can mean that a deal-killing objection pops up late in the deal from someone marketing never touched.
Use this metric to identify coverage gaps before accounts enter the pipeline. If only one contact in a five-person buying group is being reached, focus efforts on engaging the untouched stakeholders before the deal progresses too far.
3. Journey stage progression
Journey stage progression is an important indicator that your ABM ads are actively influencing pipeline.
It measures the number of contacts within an ad cohort that are advancing through defined buyer journey stages over a given period, signaling that your program isn’t just reaching contacts, but helping progress deals.
In Influ2, you can find this information in the Journey report, which details how many contacts progressed through each step and what criteria triggered the transition.
For example, if 30 contacts moved out of a Warm-up stage, the report breaks down how many got there by clicking an ad versus hitting an impression threshold, showing you which signals are actually driving movement.

The breakdown of what triggered each transition, clicks vs. impression thresholds, tells you which signals are actually moving people, but this ABM metric also helps you identify adjustments that need to be made to your ad sequence.
For example, a cohort where contacts are stalling at the same stage tells you that the creative, messaging, or criteria for entry into that stage may need revisiting.
Lagging ABM metrics
Lagging indicators answer questions about budget, ROI, and the value of the ABM program. If they’re increasing, you’re in better shape to advocate for more budget from leadership.
4. Marketing-influenced pipeline
Marketing-influenced pipeline measures the total value of open pipeline where at least one buying group member was exposed to a marketing program, giving you a view of how your programs are contributing to active deals before they become revenue.
In Influ2, the qualifier is whether the buying group member engaged with an ad (the engagement threshold being one click or 15+ impressions) within 15 days of a positive sales outcome.
These qualifiers are important. Calling an account “influenced” when one contact saw one ad 90 days ago isn’t exactly a fair test of marketing’s impact on that deal.
Influ2's Revenue Report shows marketing-influenced pipeline, broken down by:
- Influenced buying groups
- Booked meetings
- Generated pipeline
- Progressed pipeline
5. Influenced vs. cold conversion rate
This ABM metric measures the conversion rate of pipeline that was influenced by your ads and compares it to pipeline that wasn't.
It helps answer the objection that every ABM leader eventually faces: “Would those deals have closed anyway?” It's a fair objection, especially when combined with the old “You’re only going after the best accounts.” Influenced vs. cold conversion rate helps put both objections to rest.
A higher conversion rate on influenced pipeline is evidence that your ABM program is having a genuine impact on revenue generation—accounts that engaged with your ads closed at a higher rate than those that didn’t.
It’s pretty hard to make the case clearer than that, and that’s precisely why this metric belongs in your ABM reporting dashboard, as it allows you to communicate with CFOs and sales leadership by framing marketing's value in terms they already care about rather than asking them to interpret marketing-specific metrics.
Influ2's Value Analysis report shows influenced vs. cold conversion rate by default. It splits your total pipeline into influenced (at least one buying group member met the click or impression threshold) and cold (no ad influence), then compares conversion rates between the two groups.
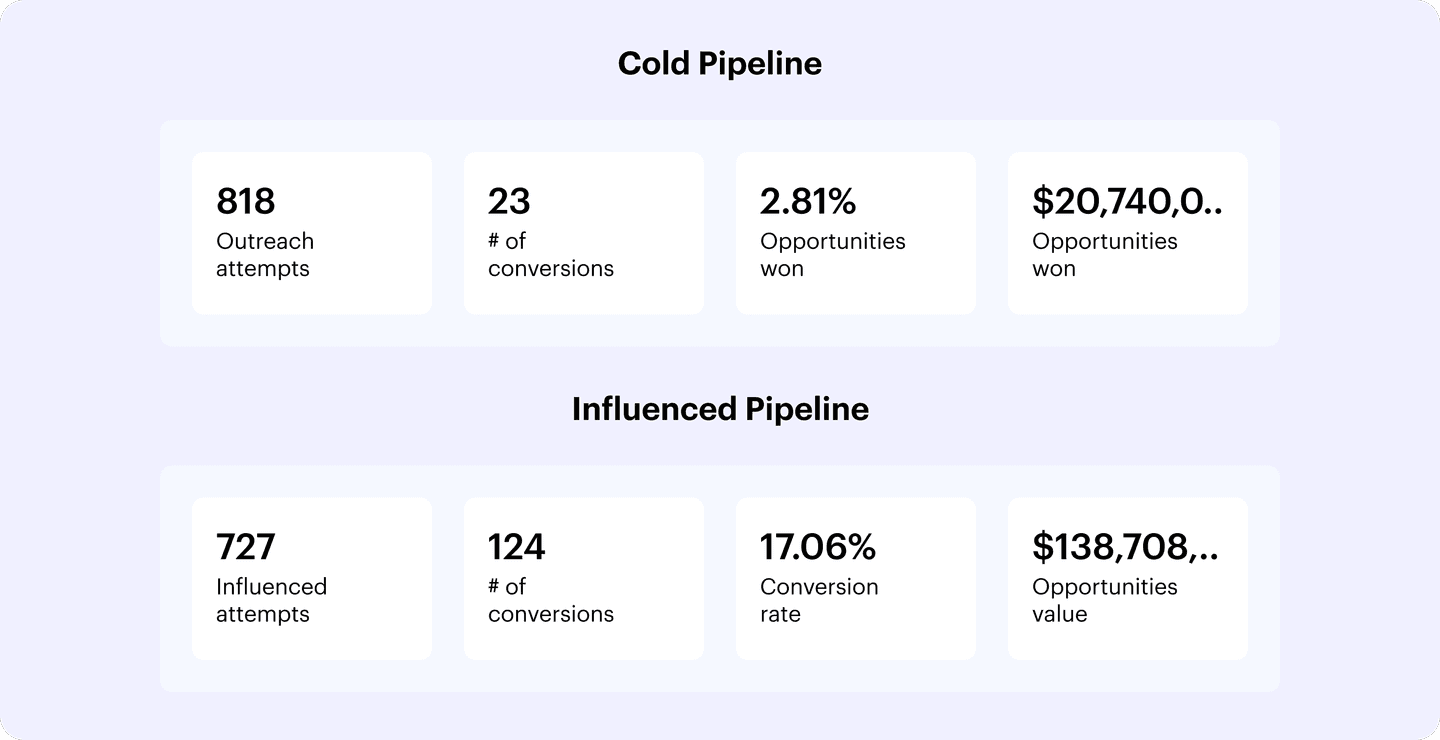
The lift is the gap between those two numbers, expressed as a percentage increase.
6. Marketing-influenced revenue
Marketing-influenced revenue tracks the total closed-won revenue from deals where at least one buying group member was influenced by your campaign.
It’s the same concept as a marketing-influenced pipeline, but applied to revenue.
Comparing the two figures also tells you where your program's influence is strongest. If influenced pipeline is strong but influenced revenue is falling behind, it points to a late-stage coverage problem: either the right contacts aren't being reached, or the messaging isn't connecting with what they care about at that point in the buying process.
Marketing-influenced revenue is also one of the most important ABM metrics for demonstrating program influence to leadership, telling them whether the program is worth the investment by connecting ABM spend directly to closed business in language every executive understands.
Despite that, according to our Forrester report, only 31% of ABM teams currently track total influenced revenue, which means most programs are leaving their strongest proof point unused.
Influ2's Revenue Report tracks this directly as the final stage in the influenced pipeline breakdownABM metrics.
The right ABM metrics are the ones that connect to revenue
The metrics that matter most in ABM aren't always the ones readily available in your ABM tool. They're the ones that connect your program to the outcomes leadership actually cares about.
Influ2 gives you the data behind all six of these ABM metrics, from buying group coverage through to marketing-influenced revenue, so you can report on what your program is actually doing without stitching together data from five different tools.
Dominique Jackson is a Content Marketer Manager at Influ2. Over the past 10 years, he has worked with startups and enterprise B2B SaaS companies to boost pipeline and revenue through strategic content initiatives.


